A wave crosses a glass interface
The static illustration remains available while the recorded Meep fields load. Interactive playback requires JavaScript and a web server.
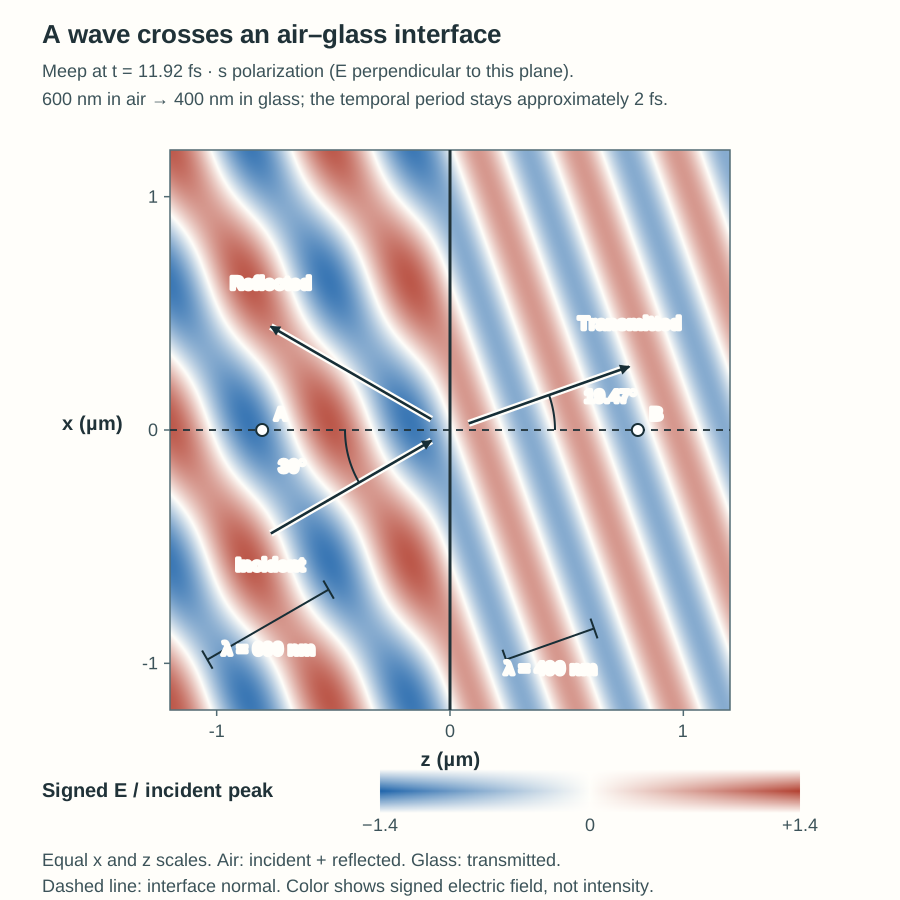
Explore: a wave crosses a glass interface
Recorded Meep fields: the local electric field oscillates while the wave pattern propagates.
E is perpendicular to the drawing plane (s polarization). Color shows signed electric field, not intensity; arrows mark wave propagation directions. The interface and observation points stay fixed. All times are greatly slowed.
Paused. Click Play to start.
At two fixed observation points
● A · air, incident reference■ B · glass, transmitted field
Both traces use the same time and field scales. A six-period window follows the selected recording time, stopping at the recording boundaries.
Lossless, nondispersive air (n = 1) and glass (n = 1.5), separated by one planar interface. These are precomputed Meep fields; students do not need to install or run Meep. The map excludes the source and absorbing boundaries. Direction arrows and wavelength brackets are geometric guides; they do not move with the field.
About this recording
A two-dimensional Meep simulation records complex fields along the axial coordinate. The map reconstructs their transverse dependence using the imposed Bloch phase. The incident-only view comes from a separate air-only reference run; subtraction isolates the reflected field in air. No analytical wave field replaces the recorded simulation data.